
テレフォニーメトリックを表示する
- テレフォニー > プラグイン > すべて 許可
Genesys Cloud を使用すると、ライブ メトリックのカスタム ダッシュボードを作成して、Genesys Cloud テレフォニー ネットワークのパフォーマンスを監視できます。BYOC Premises テレフォニー接続オプションに固有のメトリック セットがあり、すべてのテレフォニー接続オプションに適用されるメトリックがあります。BYOC Premises、BYOC Cloud、および Genesys Cloud Voice。追跡するメトリックを選択し、グラフの外観をカスタマイズできます。ダッシュボードでは、複数のグラフを表示し、ドラッグ アンド ドロップを使用して画面上で移動できます。事前に設定されたさまざまなレイアウトを選択することもできます。
BYOC施設の指標
| メトリックタイプ | メトリクス | 説明 |
|---|---|---|
| エッジメトリクス | 帯域幅 | 各エッジでの帯域幅の使用量は、使用可能な帯域幅のパーセンテージまたはバイト数として表されます。 |
| 通話回数 | 選択したエッジを通過する現在の通話数。 | |
| CPU | 各エッジの CPU 使用率。 | |
| メモリ | 各エッジでのメモリ使用量。 | |
| QoSの不一致 | エッジ上の QoS 不一致の合計数。統計は 24 時間のスライディング ウィンドウ中に測定されます。 | |
| ストレージ | 各エッジのストレージ容量。 |
BYOC Premises、BYOC Cloud、Genesys Cloud Voiceのメトリクス
| メトリックタイプ | メトリクス | 説明 |
|---|---|---|
| トランクメトリクス | 通話回数 | トランクを通過する現在の通話数。 |
| QoSの不一致 | トランク上の QoS 不一致の合計数。 統計は 24 時間のスライディング ウィンドウ中に測定されます。 |
メトリクスを追加する
- クリックメニュー>デジタルとテレフォニー>電話>メトリクス。
- ウィジェットを追加するをクリックします。
- 下指標の種類を選択してください、タイルをクリックしてメトリックを選択します。
- クリック次のステップ。
- 次のセクションの情報を使用して、メトリックの設定を構成します。
エッジメトリクス
帯域幅使用量ソース
下エッジどちらかを選択してくださいオンプレミスサイト内のすべてのエッジまたはエッジ。
-
- 選択した場合オンプレミスサイト内のすべてのエッジをクリックし、ドロップダウンを使用して 1 つ以上のサイトを選択します。
- 選択した場合エッジをクリックし、ドロップダウンを使用して 1 つ以上のエッジを選択します。
下表示オプション、表示する使用状況メトリックの種類と、そのメトリックを表示する測定単位を選択します。
- 見せる
- エッジあたりの使用量
- ネットワークインターフェースごとの使用量
- ユニット
- パーセント
- 送受信バイト数
通話カウントソース
下エッジどちらかを選択してくださいオンプレミスサイト内のすべてのエッジまたはエッジ。
- 選択した場合オンプレミスサイト内のすべてのエッジをクリックし、ドロップダウンを使用して 1 つ以上のサイトを選択します。
- 選択した場合エッジをクリックし、ドロップダウンを使用して 1 つ以上のエッジを選択します。
下表示オプション、監視するトランク タイプと監視する通話のタイプを選択します。
- トランクスタイプ
- 外部
- 電話
-
コール
- すべてのインバウンドとアウトバウンド
- インバウンド
- 発信数
CPU使用率ソース
下エッジ、 選ぶオンプレミスサイト内のすべてのエッジまたはエッジ。
- 選択した場合オンプレミスサイト内のすべてのエッジをクリックし、ドロップダウンを使用して 1 つ以上のサイトを選択します。
- 選択した場合エッジをクリックし、ドロップダウンを使用して 1 つ以上のエッジを選択します。
下表示オプション、CPU を表示する方法を選択します。
- すべてのCPUの平均
- CPU
メモリ使用量のソース
下エッジどちらかを選択してくださいオンプレミスサイト内のすべてのエッジまたはエッジ。
- 選択した場合オンプレミスサイト内のすべてのエッジをクリックし、ドロップダウンを使用して 1 つ以上のサイトを選択します。
- 選択した場合エッジをクリックし、ドロップダウンを使用して 1 つ以上のエッジを選択します。
下表示オプション、監視するメモリの種類を選択します。
- 物理メモリ
- 物理メモリと仮想メモリ
QoS不一致の原因
下エッジどちらかを選択してくださいオンプレミスサイト内のすべてのエッジまたはエッジ。
- 選択した場合オンプレミスサイト内のすべてのエッジをクリックし、ドロップダウンを使用して 1 つ以上のサイトを選択します。
- 選択した場合エッジをクリックし、ドロップダウンを使用して 1 つ以上のエッジを選択します。
下表示オプション、監視するトランク タイプと監視する通話のタイプを選択します。
- 外部
- 電話
ストレージ使用量ソース
下エッジどちらかを選択してくださいオンプレミスサイト内のすべてのエッジまたはエッジ。
- 選択した場合オンプレミスサイト内のすべてのエッジをクリックし、ドロップダウンを使用して 1 つ以上のサイトを選択します。
- 選択した場合エッジをクリックし、ドロップダウンを使用して 1 つ以上のエッジを選択します。
下表示オプション、監視するストレージ デバイスの種類を選択します。
- すべてのストレージデバイス
- 録画保存
- 回復ストレージ
トランクメトリクス
下トランクスどちらかを選択してください外部トランクまたは電話トランク。
- 選択した場合外部トランクをクリックし、ドロップダウンを使用して 1 つ以上の外部トランクを選択します。
- 選択した場合電話トランクをクリックし、ドロップダウンを使用して 1 つ以上の電話トランクを選択します。
下表示オプション、表示するメトリックと表示する通話の種類を選択します。
メトリックを表示
- トランクあたり
- エッジインターフェースごと
コール
- すべてのインバウンドとアウトバウンド
- インバウンド
- 発信数
下トランクスどちらかを選択してください外部トランクまたは電話トランク。
- 選択した場合外部トランクをクリックし、ドロップダウンを使用して 1 つ以上の外部トランクを選択します。
- 選択した場合電話トランクをクリックし、ドロップダウンを使用して 1 つ以上の電話トランクを選択します。
下表示オプション、表示するメトリックを選択します。
メトリックを表示
- トランクあたり
- エッジインターフェースごと
- 下時間枠ドロップダウンを使用して期間を選択します。 注記:[現在] を選択すると、現在の値のみが表示され、ゲージまたは棒グラフとして表示されます。ただし、特定の期間を選択すると、常に折れ線グラフが作成されます。
- クリック次のステップ。
- 下タイトルウィジェットの名前をウィジェットのタイトル箱。 注記:各ウィジェットには設定方法に基づいてデフォルトのタイトルが割り当てられますが、カスタム タイトルを作成することもできます。
- ウィジェットを追加するをクリックします。
レイアウト
メトリックを選択して設定を構成すると、各メトリック ウィジェットが追加した順序で [メトリック] ページに表示されます。ただし、メトリクス ページのレイアウトを編集およびカスタマイズすることはできます。
- クリックレイアウトの編集メトリック ウィジェットを [メトリック] ページ上の任意の場所にドラッグします。
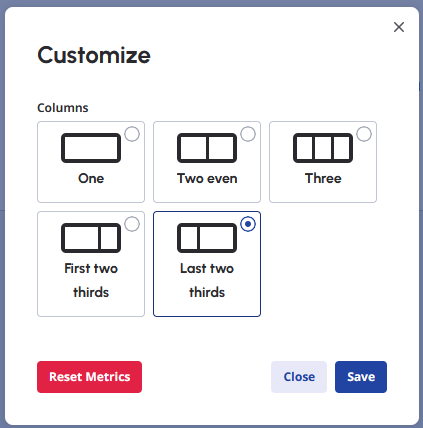
- クリックカスタマイズメトリック ページの列レイアウトを選択して保存します。
Genesys Cloudでは、ライブメトリックスのカスタムダッシュボードを作成して、Genesys Cloudテレフォニーネットワーク内のエッジとトランクのパフォーマンスを監視できます。 追跡したいメトリクス選択し、グラフの外観をカスタマイズできます。 ダッシュボードを使用すると、複数のグラフを表示し、ドラッグアンドドロップを使用してディスプレイ上でそれらを移動できます。 さまざまな事前構成済みレイアウトを選択することもできます。
| メトリックタイプ | メトリクス | 説明 |
|---|---|---|
| Edge | 帯域幅の利用状況 | 使用可能な帯域幅の割合として表される各Edgeの帯域幅の使用率 |
| CPU 利用状況 | 各Edgeの CPU 使用率 | |
| Edge ごとのコール数 | 現在 Edge を通過中のコール数です | |
| メモリー利用状況 | 各Edgeのメモリ使用量 | |
| ストレージの使用状況 | 各Edgeのストレージ容量 | |
| Edge ごとの QoS 不一致 | Edgeでの QoS の不一致の合計数。 (スライドウィンドウ)。 | |
| トランク | トランクごとのコール数 | トランクを通過するコールの現在の数 |
| トランクごとの QoS 不一致 | 過去24時間におけるトランク の QoS不一致の総数です (スライドウィンドウ)。 |
メトリクスを追加する
- 管理をクリックします。
- [テレフォニー] で、 メトリクスをクリックします。
- クリックメニュー>デジタルとテレフォニー>電話>メトリクス。
- クリック メトリックを追加.
- 下新しいグラフ、グラフの名前を入力します 名前 ボックス。 メモ: [Name]ボックスを空白のままにすると、Genesys Cloudは、選択した内容に基づいて名前を自動的に作成します。
- から メトリック リストでメトリックを選択してから、関連オプションを構成します。
- 下 にとって、選択 サイト内のすべてのエッジ または エッジ.
- 選んだら サイト内のすべてのエッジ、 使用 サイトを選択 1つ以上のサイトを選択するリスト。
- 選んだら エッジ、 使用 エッジを選択 リストを使用して、1つ以上のエッジを選択します。
- 選択したエッジベースのメトリックに関連付けられているオプションから選択します。
| エッジベースのメトリック | オプション |
|---|---|
| 帯域幅の利用状況 |
グラフの表示方法
|
| CPU 利用状況 |
グラフの表示方法
|
| Edge ごとのコール数 |
トランク タイプ
グラフの対象
|
| メモリー利用状況 |
グラフの表示方法
|
| ストレージの使用状況 |
グラフの表示方法
|
| Edge ごとの QoS 不一致 |
グラフの表示方法
|
- 下にとって、選択 外部トランクまたは電話トランク.
- 選んだら 外部トランク、使用 外部トランクを選択 リストを使用して、1つ以上の外部トランクを選択します。
- 選んだら 電話トランクス、使用 電話トランクを選択 リストを使用して、1つ以上の電話トランクを選択します。
- 選択したトランクベースのメトリックに関連付けられているオプションから選択します。
| トランクベースのメトリック | オプション |
|---|---|
| トランクごとのコール数 |
グラフの表示方法
グラフの対象
|
| トランクごとの QoS 不一致 |
グラフの表示方法
|
- クリック保存新しいメトリック グラフが表示されます。
グラフの実行中に、マウスポインタをグラフの上に置くと、測定ポイントが表示されます。
グラフを修正する
グラフが起動したら、グラフの表示を変更できます。
凡例を非表示/表示
凡例を削除するには、をクリックします 伝説を隠す. 非表示の凡例を表示するには、をクリックします 伝説を見る.
グラフを編集する
種類を変更するにメトリクスクリック、または選択したトランクまたはエッジを 編集 .
グラフの期間を変更する
To変更tメトリックの期間, クリック ズーム 期間を選択します。
表示を展開する
グラフの表示サイズを大きくするには、拡大する。グラフのサイズを小さくするには、[Esc]キーを押すか、近い。
変更ダッシュボード レイアウト
ダッシュボードのレイアウトを変更するには、レイアウトをクリックします。
を選択し、view optionを選択します。
グラフを削除する
グラフを削除するには、編集 をクリックし、削除をクリックします。