フローインサイトを使用して、実行されたフローコンポーネントの頻度を表示する
- Analytics > Flow Execution Aggregate > View 権限
- Architect > Flow Instance > View 権限
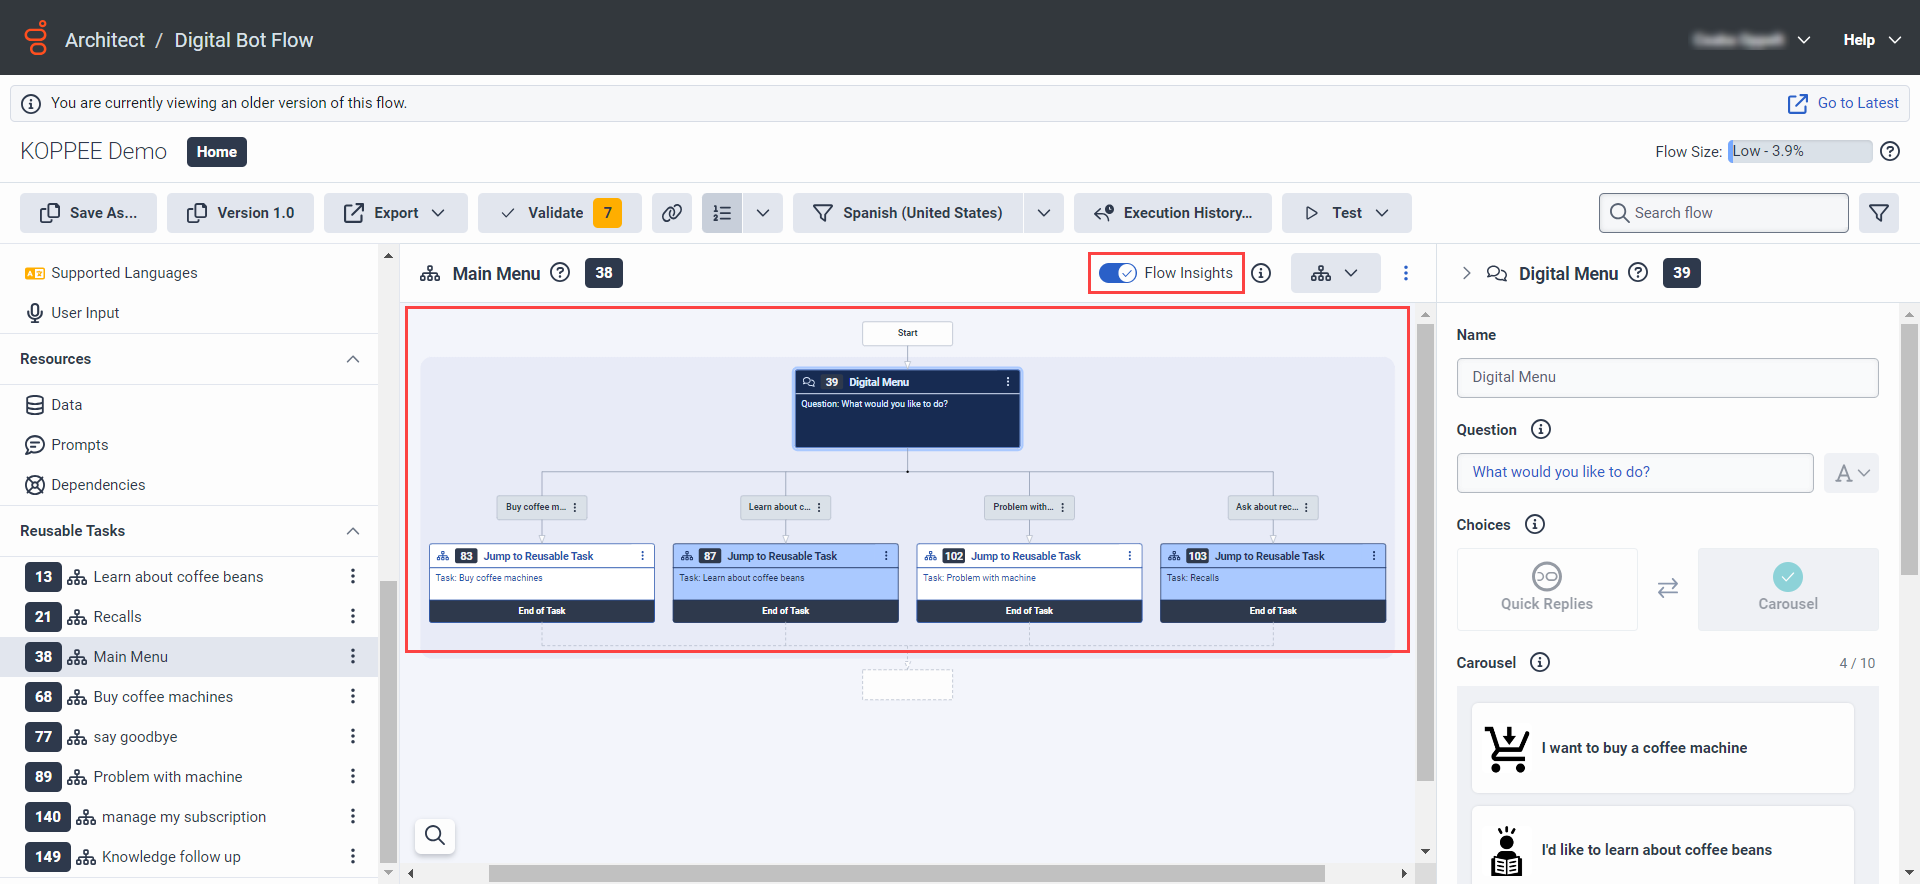
フローを利用する洞察Architect で切り替えて、開始または再利用可能なメニューやタスク、フロー アクションなど、以前に実行されたフロー コンポーネントの頻度を表示します。Architect は、Architect フロー内のフロー インサイト オーバーレイとして頻度メトリックを表示します。 オーバーレイを使用すると、フロー コンポーネントの頻度の概要を簡単に確認でき、Architect フローを改善または最適化するために重点を置くコンポーネントを決定するのに役立ちます。
- 着信コール
- 発信コール
- セキュアコール
- ボイスメール
- ボット フロー
- デジタルボットの流れ
- 受信メッセージ
- 受信メール
- 音声調査
- キュー内通話
- In-queue Email
- キュー内メッセージ
- ワークフロー
- Workitem
- アンケートへの招待
可視化ツールとしてのFlow Insights
フローインサイトのオーバーレイでは、 Architect フローで最も頻繁に実行されるフロー アクション、メニュー項目、状態、およびタスクをすばやく確認できます。視覚化により、カスタマー行動の傾向や、フローの改善または最適化が必要な領域を特定できます。頻度カウントと色分けにより、封じ込め率、タスク完了率、ドロップオフ率などのフロー パフォーマンス メトリックに関する洞察も得られます。
- Flow Insights の切り替えは読み取り専用モードでのみ有効にできます。
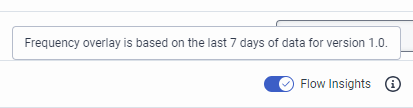
- この機能は最大7日間データ。データは、フローが終了した後にのみ Flow Insights で利用できるようになります。進行中のやり取りに関する分析情報は表示されません。
Architect が使用する表示しているフローのバージョンで利用可能な分析データが表示され、利用可能な場合は最大 7 日間のデータに基づく頻度オーバーレイが表示されます。Architect は、現在の時刻ではなく、非公開になった日付より前の 7 日間の古いバージョンの分析データを照会します。
Architect は周波数をどのように計算しますか?
頻度オーバーレイはリアルタイムで更新されますが、更新を確認するには Architect ホームページを更新する必要があります。周波数レベルには 4 つのレベルがあります。ずエロ、低い(0~24%)中くらい(25~49%)高い(50~74%)と非常に高い(75~100%)。フロー コンポーネントの頻度レベルは、フローの複雑さ、フロー内のコンポーネントの深さ、およびフローのトラフィック レベルによっても異なります。
Architect は、ユニーク セッション数 (ユーザーがフローと対話した回数) に基づいて頻度を計算します。 ボットおよびデジタル ボット フローの場合、固有のボット インタラクションは固有のセッションとしてカウントされます。その他の Architect フロー タイプの場合、フロー実行インスタンスは一意のセッションとしてカウントされます。
Architectは頻度を次のように計算します。
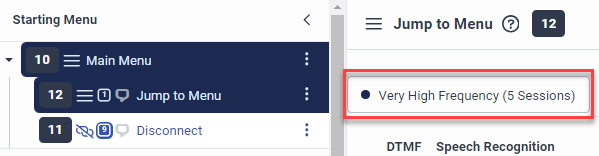
- ボットを起動する、メニュー、および状態のタスクについては、頻度とは、ユニークなボットフローセッション開始タスク、メニュー、または状態が実行された場所です。つまり、開始メニューまたは開始ボットまたは状態タスクの実行頻度は、フロー全体の実行回数に基づいています。頻度カウントと対応する色分けは、その実行カウントとフロー実行の合計数の比率を示します。メインメニューそしてそのメニューへジャンプ着信コールフローの一部としてサブメニュースタートメニュー5 回のフロー実行のうち 5 回。カスタマーは通話を切断することを選択しませんでした:
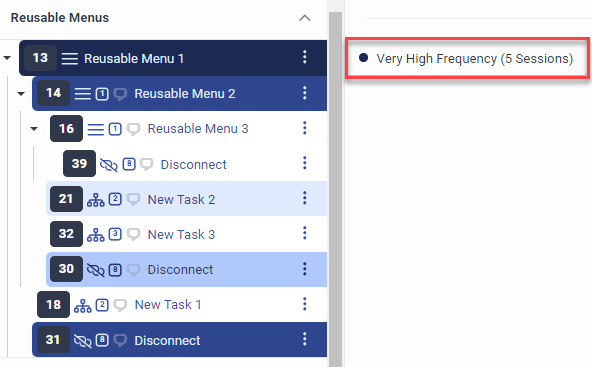
- 再利用可能なメニューの頻度とは、ユニークなボットフローセッション再利用可能なメニューが実行された事を意味します。つまり、再利用可能なメニューの実行頻度は、フロー全体の実行回数に基づいて決まります。頻度カウントと対応する色分けは、再利用可能なメニューの実行回数とフロー実行の合計回数の比率を示します。次の例では、カスタマーはメニューへジャンプ着信コールフローの一部としてサブメニュースタートメニュー5 回のフロー実行のうち 5 回。
- のメニューへジャンプサブメニューはカスタマーを指定された再利用可能なメニュー 1 5回中5回。Architect は、特定の再利用可能なメニュー項目をセッションごとに 1 回だけカウントします。つまり、カスタマーが再利用可能なメニュー 1 3 回目の通話中に 2 回発生しましたが、Architect はこれら 2 回のやり取りを 1 回としてカウントしました。
- カスタマーは再利用可能なメニュー 2 3回。
- カスタマーは31番で3回通話を切断した。切断サブメニューと30の数字を2回切断サブメニュー。

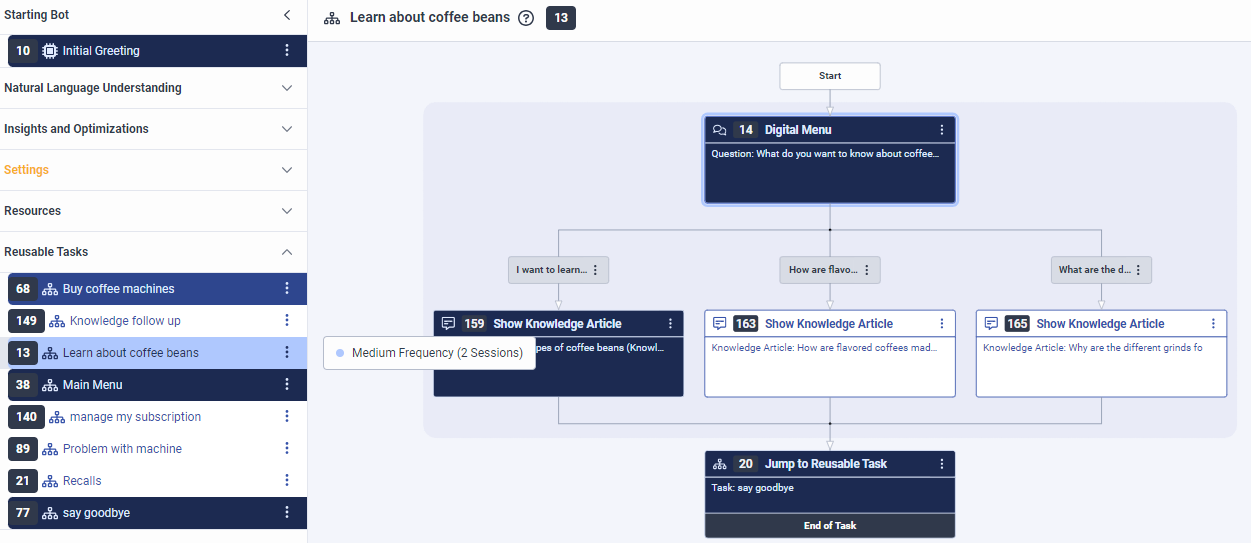
- 再利用可能なタスクでは、頻度とはの数ユニークなボットフローセッション再利用可能なタスクが実行された場所を意味します。つまり、再利用可能なタスクの実行頻度は、フロー全体の実行回数に基づいて決まります。頻度カウントと対応する色分けは、再利用可能なタスクの実行回数とフロー実行の合計回数の比率を示します。次の例では、カスタマーはボット起動デジタルボットのタスクを 5 回 (セッション) フローします。のボット起動タスクはカスタマーをメインメニュー再利用可能なタスクが非常に高い頻度で発生します (5 回中 5 回)。そして、カスタマーはコーヒー豆について学ぶ再利用可能なタスクを2回実行し、コーヒーマシンを購入する5 つのボット フロー セッションのうち 3 回は再利用可能なタスクです。
画像をクリックして拡大します。

- ボットタスク、再利用可能なメニュー、タスクの開始時のアクションの場合、頻度はボットフローセッションのユニーク数アクションはすべての可能なエントリ ポイントに対して実行されました。つまり、Architect は、アクションの実行回数を親メニューまたはタスクが実行された合計回数に対して測定します。次の例では、カスタマーはボット起動デジタルボットのタスクを 5 回 (セッション) フローします。のボット起動タスクはカスタマーをメインメニュー再利用可能なタスクが非常に高い頻度で発生します (5 回中 5 回)。そして、カスタマーはコーヒー豆について学ぶ5 つのボット フロー セッションのうち 2 回の再利用可能なタスク。Architect は、デジタルメニューアクションをコーヒー豆について学ぶタスク内でカスタマーが非常に頻繁にインタラクションしている事を示しています。頻度カウントとそれに対応する色分けデジタルメニューアクションは、アクションの実行回数(2)と、コーヒー豆のタスクについて学ぶ処刑された(2人)。
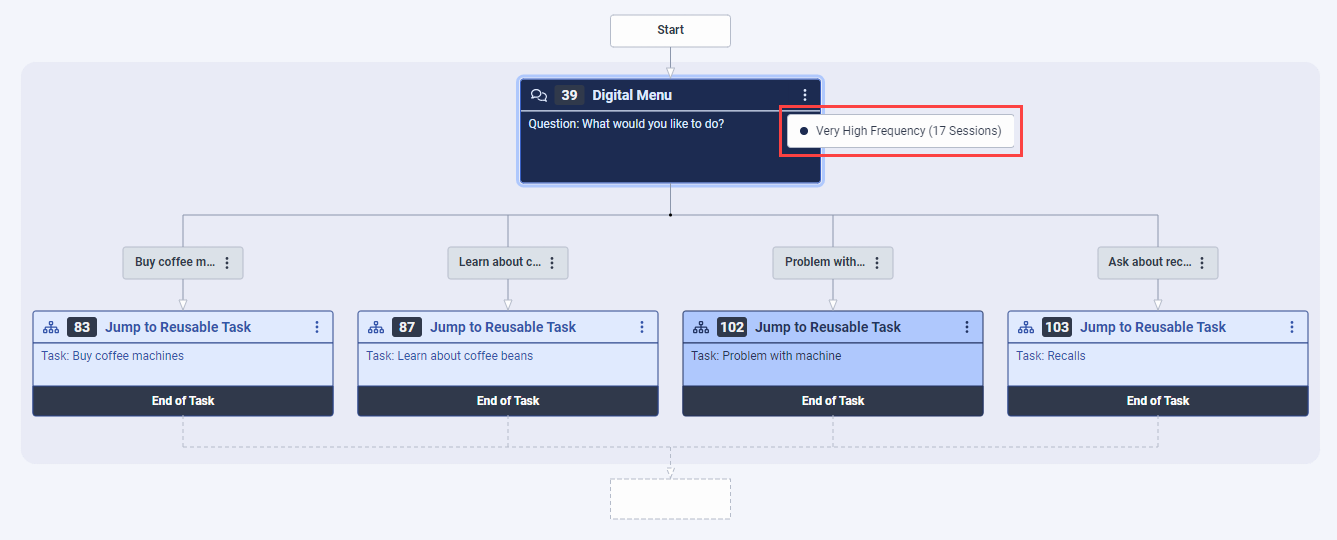
画像をクリックして拡大します。
ボット フローの合計セッション数、つまりボット インタラクション数が 17 であるとします。メモ: Architect の最適化ダッシュボードを使用して、ボット フローのボット インタラクションの合計数を表示します。 詳細については、最適化ダッシュボードでボットとデジタルボットの指標を表示するをご覧ください。 Flow Insightsのデータとは異なり、ボットインタラクション数の合計に関するデータは、最適化ダッシュボードはバージョン固有ではありません。 したがって、複数のバージョンを持つボットの場合、最適化ダッシュボードのデータが一致しない可能性があります。各セッションがデジタルメニューアクション再利用可能なタスクで。Architect が 17 回のセッションでこのアクションを 17 回実行したため、このアクションの頻度レベルは非常に高くなっています。
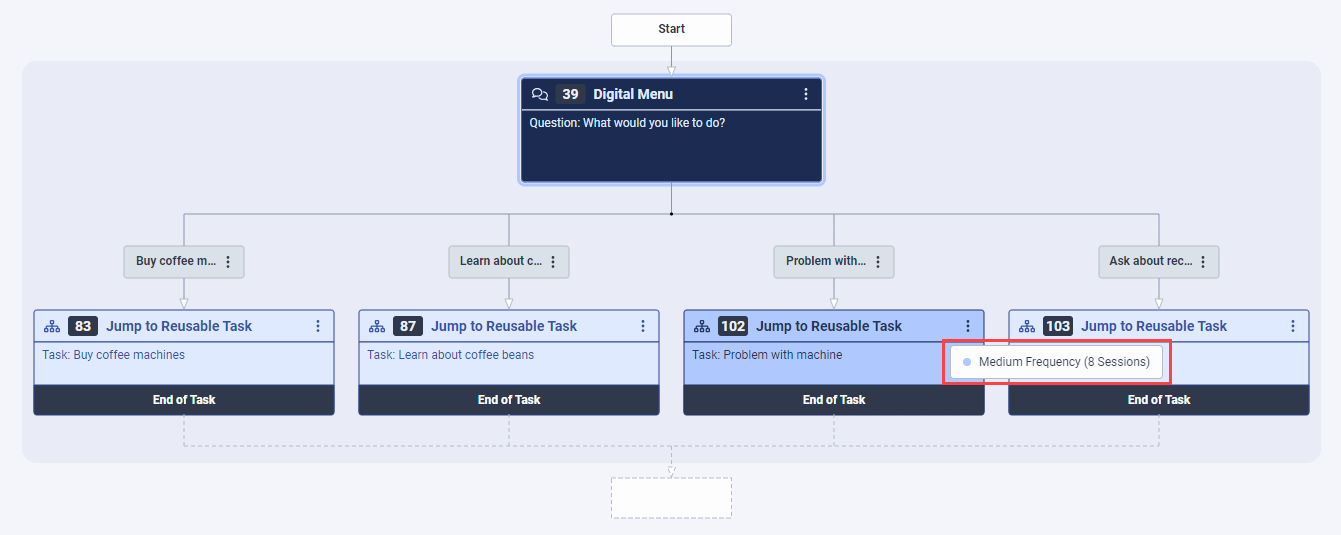
画像をクリックすると拡大します。 8つのセッションのみが再利用可能なタスクアクションにジャンプ同じ再利用可能なタスクで。として頻度の割合は 25% から 50% の間で、頻度レベルは中程度です。
画像をクリックすると拡大します。
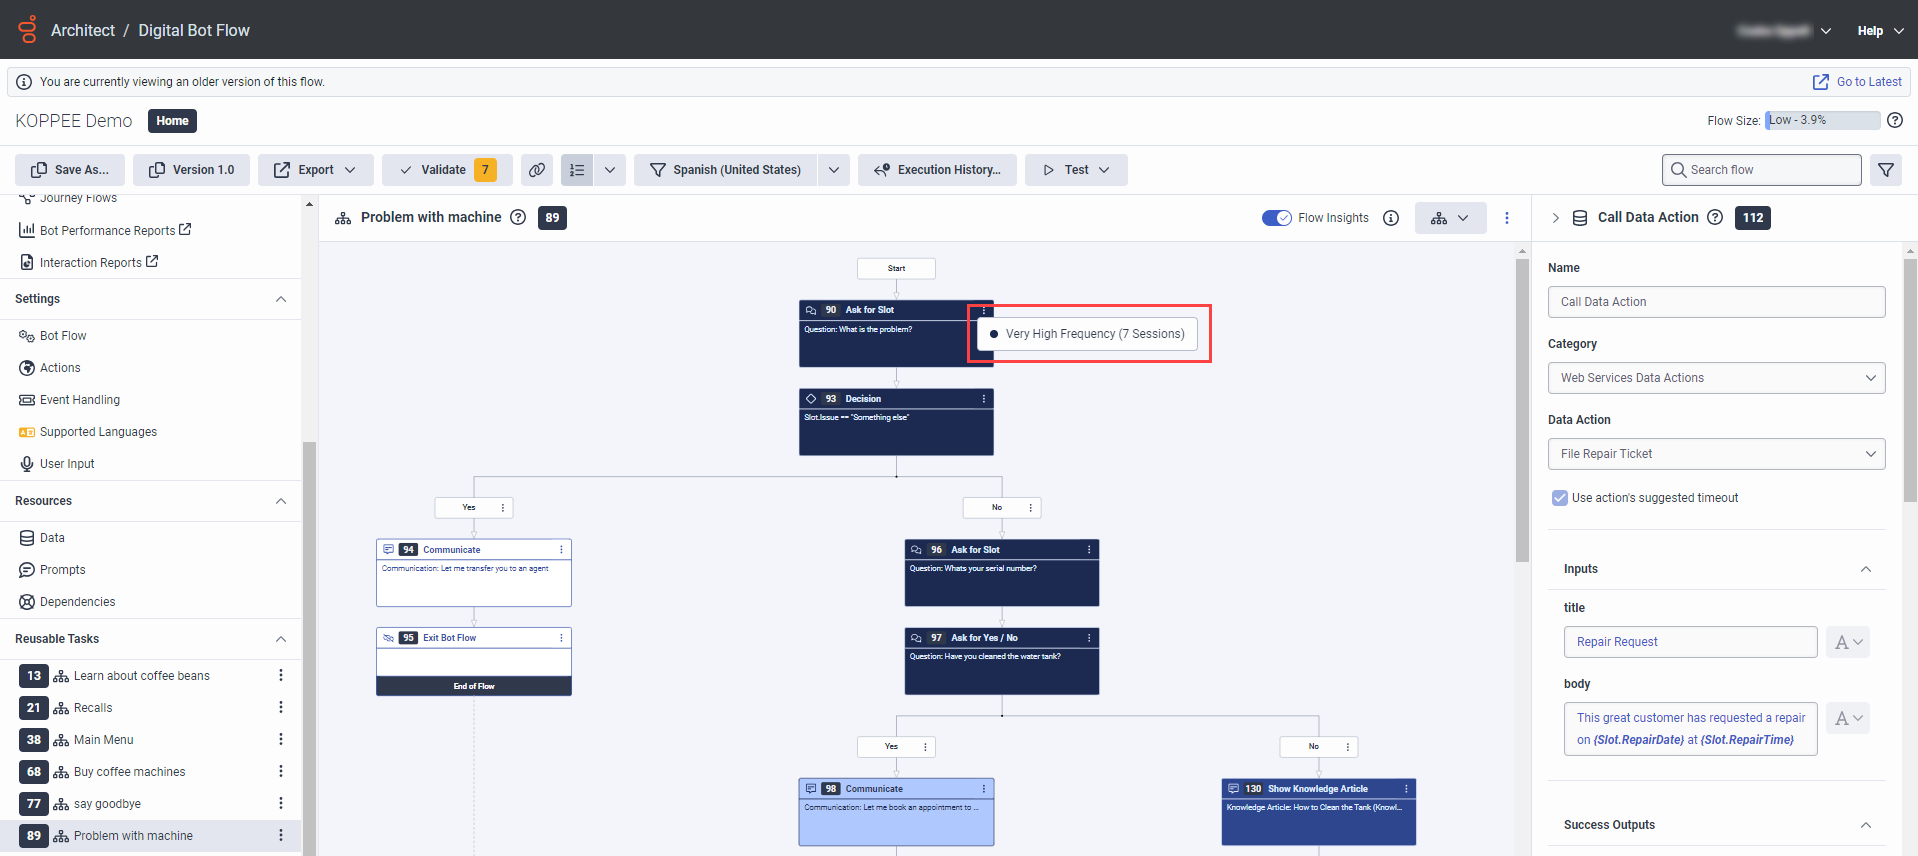
- あなたは はい/いいえのアクションを要求する そして2つ 行動を伝達する メインで、または 起動ボット 一連の流れ。
- の 起動ボット シーケンスには 10 のセッションがあり、そのうちの 6 つが最初の Communicate アクションを実行します。 Architect は、最初の Communicate アクションに対して高い (60%) 頻度スコアを計算します。
- の再利用可能なタスクシーケンスには 5 つのセッションがあり、そのうち 3 つが最初の通信アクションを実行します。Architect は、再利用可能なタスクを経由したセッションと同じ割合でこの通信アクションが実行されたため、このアクションに対しても高頻度スコア (60%) を計算します。
フロー コンポーネントの頻度とフロー コンポーネントが実行されたセッションの数を表示するには、それぞれのコンポーネントの上にマウスを置きます。
画像をクリックして拡大します。
Flow Insights が有効になっているか、または頻度オーバーレイが何日分のデータに基づいているかを確認するには、 フローインサイト トグル のとなりにあるヘルプアイコンの上にカーソルを置きます。。 エラーがあるか、データが不足しているかどうかも確認できます。